


INTRODUCTION
Sudden cardiac arrest (CA) is critical for its high morbidity and mortality worldwide.[1] Although recent advances in resuscitation strategies such as extracorporeal life support have increased the ratio of CA survivors, only 10.4% of CA patients survive hospitalization, and 8.2% are discharged with good cerebral performance status.[2,3] Post-CA patients are highly likely to face survival in unresponsive wakefulness or even death resulting from hypoxic-ischemic brain injury (HIBI). Severe HIBI leads to diffuse cerebral edema and delayed neuronal death.[4] Thus, early prognostication of neurological outcomes may be helpful in making therapeutic decisions and in deciding the proper withdrawal of life-sustaining treatment.
Immediate cerebral computed tomography (CT) is conducted after return of spontaneous circulation (ROSC) for evaluating neurological causes of CA.[5] A previous study has already shown the value of brain CT in predicting unfavorable outcomes.[6] Lopez Soto et al[7] took CT within 24 h after CA into consideration and demonstrated low prediction sensitivities. Few studies have involved CTs from a later time point. The disappearance of the boundary between grey and white matter is the main CT finding in severe HIBI patients, which can be quantified by calculating the grey-to-white matter ratio (GWR) through Hounsfield units (HU). GWR is lower in patients with unfavorable outcomes.[8] In addition, as another objective CT indicator, the proportion of cerebrospinal fluid volume (pCSFV) in the volume of the intracranial component, which is correlated with cerebral edema, can be analyzed using quantitative techniques. A lower pCSFV has suggested more severe brain swelling.[9]
Most retrospective research assessing the predictive value of brain CT concentrates on the post-CA hyperacute period, with images obtained during the first 24 h.[10] However, little is known about the importance of CT performance time and the corresponding changes in GWR and pCSFV in CA survivors.[11] In this study, we aimed to assess the association between relevant brain CT parameters (GWR and pCSFV) at different time and neurological prognosis in adult comatose survivors after CA.
METHODS
Study population
This was a retrospective observational study recruiting patients with CA from January 2018 to April 2020 at the First Affiliated Hospital of Nanjing Medical University. Patients with persistent coma, defined as a Glasgow Coma Scale (GCS) score ≤8 more than 24 h after ROSC, were eligible for inclusion. All eligible patients underwent two rounds of brain CT scans, including early CT (within 24 h after CA) and late CT (24 h to 7 d after CA). Patients under 18 years of age, with terminal malignancy or with baseline neurological disorders were excluded. Furthermore, patients with CT images that indicated parenchymal abnormalities, or that were technically insufficient to determine cerebral density, or that were unavailable for assessment were all excluded. The flow chart of patient enrollment is shown in Figure 1. In total, 94 patients were enrolled in this study. According to the Utstein style,[12] data were systematically collected, including age, gender, comorbidities, CA location, bystander cardiopulmonary resuscitation (CPR), etiology of CA, initial rhythm, and time duration from the beginning of CPR to ROSC. The study protocol was granted approval by the Ethics Committee of the First Affiliated Hospital of Nanjing Medical University (2018-SR-356) with a waiver of informed consent.
Figure 1.
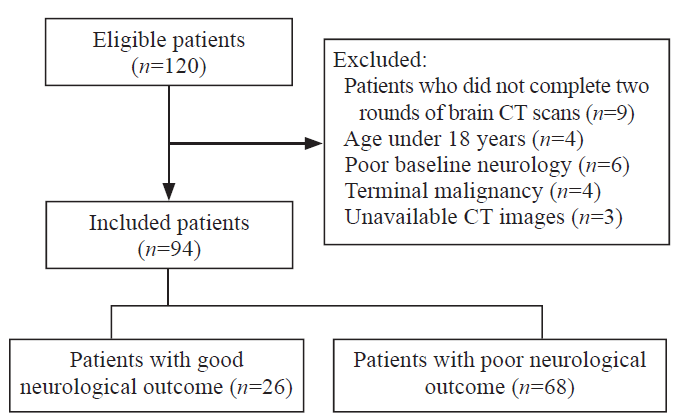
Figure 1.
Flow chart of patient enrollment.
GWR determination and pCSFV analysis
The GWR was determined using the method described in our previous report.[13] All CT scans with a slice thickness of 5 mm were performed using a GE Optima 520Pro scanner (GE Healthcare, Japan). Circular regions (10-15 mm2) for measurement were manually placed over the regions of interest (ROIs), which were decided by two expert investigators (WC and XQX). The attenuation values (calculated using HU) of the caudate nucleus (CN), putamen (PU), corpus callosum (CC), and posterior limb of the internal capsule (PLIC) at the level of the basal ganglia were measured. The GWR was calculated as the average of values measured independently by the two investigators. The readers were both blinded to the neurological outcomes and the other reader’s ROI placement, as well as patient data. The inter-rater reliability of GWR was determined using the intra-class correlation coefficient (ICC).
GWR-basal ganglia = (CN+PU)/(CC+PLIC); GWR-simplified = PU/PLIC.
The voxels of the cranium and its outside soft tissues should be eliminated to analyze the CT images’ intracranial components. According to their HU values, the voxels of the foreign body and cranium can be easily eliminated by MATLAB software. The brain extraction tool (BET) function within the FMRIB Software Library (FSL) was applied in order to manage extractions to remove external soft tissue at a fractional strength of 0.01 (supplementary Figure 1). A median filter was used to reduce the noise influence in CT images and improve the signal-to-noise ratio. Generally, the HU value of major intracranial components is not < 0 or > 80, and the cerebrospinal fluid (CSF) HU ranges from 0 to approximately 15. Therefore, intracranial component volume (ICCV) was defined as voxel numbers of HU from 0 to 79, and CSF volume (CSFV) referred to voxel numbers of HU from 0 to 15. Any voxels, which HU values went beyond this boundary condition, were not included, and pCSFV = CSFV/ICCV.[9,14]
In this study, the changing trends in relevant CT parameters were used for comparison analysis of different CT time in predicting outcomes. They were calculated as the ratio of parameters in late CT to those in the early CT.
Outcomes
The primary endpoint of this study was neurological outcomes at hospital discharge that were evaluated according to the Cerebral Performance Category (CPC) score.[15] The CPC score was as follows: 1=good recovery; 2=moderate disability; 3=severe disability; 4=comatose or unresponsive wakefulness syndrome; and 5=death. The patients were divided into either a good outcome (CPC 1-2) group or a poor-outcome (CPC 3-5) group.
Statistical analysis
The statistical tests were performed using SPSS software, version 23.0 (SPSS Inc., USA). Descriptive parameters were presented as the mean±standard deviation (SD) or median with interquartile range (IQR) for continuous variables and as counts with percentages (%) for categorical variables. By using t-test or Mann-Whitney U-test, the comparisons of continuous variables between the two groups were made. The comparisons of categorical variables were made by Chi-square test. In addition, the receiver operating characteristic (ROC) curve was analyzed by its corresponding area under the curve (AUC) with 95% confidence interval (CI). Based on the maximal sensitivity and specificity, the cut-off values of relevant CT parameters were calculated to predict poor neurological outcomes at hospital discharge. A two-tailed P-value <0.05 was considered to be statistically significant.
RESULTS
Clinical characteristics
The baseline characteristics of the involved patients were summarized in Table 1. Totally 26 (27.7%) patients were in the good-outcome group, while 68 (72.3%) patients were in the poor-outcome group based on the CPC score at hospital discharge. In most of the pre-CA baseline variables (age, gender, and comorbidities) and CA characteristics (CA location, cardiac etiology, initial rhythm, and duration of resuscitation), no significant differences were found between the poor- and good-outcome groups, while non-bystander CPR was associated with unfavorable outcomes.
Table 1. Clinical characteristic of enrolled patients
| Parameters | Good-outcome group (n=26) | Poor-outcome group (n=68) | P-value |
|---|---|---|---|
| Age, years | 52.62±16.30 | 49.72±19.93 | 0.511 |
| Male | 17 (65.4) | 47 (69.1) | 0.728 |
| Comorbidities | |||
| Hypertension | 12 (46.2) | 27 (39.7) | 0.570 |
| Diabetes | 6 (23.1) | 9 (13.2) | 0.395 |
| Coronary artery disease | 2 (7.7) | 9 (13.2) | 0.697 |
| Stroke | 3 (11.5) | 7 (10.3) | 0.861 |
| Out-of-hospital CA | 13 (50.0) | 38 (55.9) | 0.609 |
| Bystander CPR | 23 (88.5) | 44 (64.7) | 0.023 |
| Cardiac etiology | 15 (57.7) | 31 (45.6) | 0.294 |
| Initial shockable rhythm | 12 (46.2) | 20 (29.4) | 0.125 |
| Duration of resuscitation, min | 33.0 (19.0-45.5) | 30.0 (15.5-57.5) | 0.679 |
| GCS score after ROSC | 7.42±3.71 | 3.35±0.93 | <0.001 |
| Length of stay in hospital, d | 17.5 (14.0-28.5) | 9.0 (3.5-25.0) | 0.010 |
| CPC at hospital discharge | |||
| CPC 1 | 5 | - | |
| CPC 2 | 21 | - | |
| CPC 3 | - | 4 | |
| CPC 4 | - | 30 | |
| CPC 5 | - | 34 |
Data are expressed as the mean±standard deviation (SD) or median with interquartile range (IQR) or counts with percentages (%). CA: cardiac arrest; CPR: cardiopulmonary resuscitation; GCS: Glasgow Coma Scale; ROSC: return of spontaneous circulation; CPC: Cerebral Performance Category.
Comparison of GWR and pCSFV between different outcome groups
The inter-rater reliability of GWR showed excellent agreement (ICC 0.77). The GWR-basal ganglia of early CT were significantly lower in the poor-outcome group than in the good-outcome group (P<0.05), however, in terms of pCSFV, no significant difference was found between the two groups (P=0.824). Table 2 shows in the late CT analysis, the PU density, GWR, and pCSFV were significantly lower in the poor-outcome group (P<0.05).
Table 2. Comparison of CT parameters between different outcome groups by early (within 24 h) and late (24 h to 7 d) CTs
| Parameters | Early CT (< 24 h) | Late CT (24 h to 7 d) | ||||
|---|---|---|---|---|---|---|
| Good-outcome group (n=26) | Poor-outcome group (n=68) | P-value | Good-outcome group (n=26) | Poor-outcome group (n=68) | P-value | |
| Density of ROI, HU | ||||||
| PU | 34.1 (33.0-36.0) | 32.1 (28.2-35.9) | 0.078 | 33.5 (28.3-35.8) | 29.0 (26.0-32.0) | 0.028 |
| PLIC | 27.0 (24.4-30.0) | 28.0 (22.6-29.7) | 0.880 | 25.5 (21.3-26.9) | 25.0 (22.5-28.0) | 0.388 |
| GWR | ||||||
| Basal ganglia | 1.22 (1.16-1.29) | 1.17 (1.10-1.23) | 0.032 | 1.28 (1.23-1.35) | 1.12 (1.08-1.18) | <0.001 |
| Simplified | 1.24 (1.21-1.35) | 1.18 (1.12-1.27) | 0.052 | 1.33 (1.25-1.40) | 1.14 (1.08-1.22) | <0.001 |
| pCSFV | 0.040 (0.034-0.077) | 0.048 (0.030-0.070) | 0.824 | 0.074 (0.047-0.107) | 0.038 (0.019-0.075) | 0.010 |
Data are expressed as the median with interquartile range (IQR). CT: computed tomography; ROI: region of interest; HU: Hounsfield units; PU: putamen; PLIC: posterior limb of the internal capsule; GWR: grey-white matter ratio; pCSFV: proportion of cerebrospinal fluid volume.
Comparison analysis
The ratios of GWR and pCSFV were significantly decreased in the poor-outcome group by comparing the parameters at different CT time (P<0.05), while there was no significant difference in the ratio of PU density (P>0.05) (Figure 2).
Figure 2.
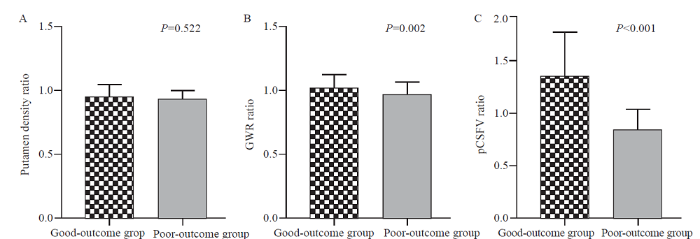
Figure 2.
Comparison between different outcome groups in putamen density ratio (A), GWR ratio (B), and pCSFV ratio (C). GWR: grey-white matter ratio; pCSFV: proportion of cerebrospinal fluid volume.
Prognostic performance of relevant CT parameters
The prognostic performances of relevant CT parameters in the prediction of unfavorable outcomes were presented in Table 3. GWR-basal ganglia <1.18 in late CT showed the optimal predictive value (AUC 0.942, 95% CI 0.884-0.998, P<0.001). Furthermore, a pCSFV <0.03 in late CT predicted unfavorable outcomes, with a sensitivity of 41.5% and a specificity of 100% (P=0.010). The pCSFV ratio <0.98 predicted poor neurological outcomes with a sensitivity of 65.9% and a specificity of 93.8% (P=0.001).
Table 3. ROC-analysis on the prediction of poor neurological outcome
| Prognostic factors | Cut-off value | Sensitivity (%) | Specificity (%) | AUC (95% CI) | P-value |
|---|---|---|---|---|---|
| GWR-basal ganglia (early CT) | 1.18 | 61.0 | 68.8 | 0.684 (0.542-0.826) | 0.032 |
| 1.12 | 31.7 | 100.0 | |||
| GWR-basal ganglia (late CT) | 1.18 | 87.8 | 93.8 | 0.942 (0.884-0.998) | <0.001 |
| 1.16 | 75.6 | 100.0 | |||
| GWR ratio | 1.01 | 78.0 | 75.0 | 0.761 (0.614-0.907) | 0.002 |
| pCSFV (late CT) | 0.03 | 41.5 | 100.0 | 0.721 (0.591-0.851) | 0.010 |
| pCSFV ratio | 0.98 | 65.9 | 93.8 | 0.788 (0.671-0.906) | 0.001 |
CT: computed tomography; GWR: grey-white matter ratio; pCSFV: proportion of cerebrospinal fluid volume; AUC: area under the curve; CI: confidence interval.
DISCUSSION
Current guidelines suggest that GWR be applied in predicting poor neurological outcomes. Nevertheless, details including the time of CT scans differ among guidelines. In 2014, the European Resuscitation Council and the European Society of Intensive Care Medicine gave an advisory statement suggesting a significant reduction in GWR within 24 h after ROSC for the prediction of unfavorable prognosis in persistent coma patients following CA.[16] Nevertheless, the 2015 American Heart Association guidelines defined the time when the CT examination should be performed as within 2 h after CA.[17] Though great efforts have been made to apply the findings for prognosis evaluation, initial CTs may not be the best time point. The reason may be that similar to ischemic stroke, tissue changes resulting in changed densities of grey/white matter and in GWR may appear in the duration of hours to days in post-CA survivors, and the immediate post-CA CT image is often normal.[18] A previous study[19] demonstrated generalized edema on brain CT that was visually detected by radiologists with no formal GWR measurement, with a sensitivity of 14.4% and a specificity of 97.6% for predicting poor outcomes within 24 h after ROSC; the same findings on brain CT performed from 24 h to 7 d after ROSC showed increased sensitivity (56.5%) and specificity (100%). The present study aimed to evaluate time-dependent GWR and pCSFV changes in comatose CA survivors, and both early (within 24 h) and late (24 h to 7 d) CTs were performed on the same patients to exclude a potential selection bias.
Currently, there is no consensus on the time of brain CT for prognostic prediction in post-CA survivors. Differences in the time of the CT and in GWR thresholds, ranging from <1.18 (performed within 48 h) to <1.22 (within 24 h), make it difficult to give an exact recommendation.[8] Furthermore, Hong et al[18] assessed the prognostic value of GWR according to early (within 2 h) and repeated CT (within 7 d) and found that GWR measured by early CT was not a statistically significant predictor of unfavorable outcomes, and the GWRs of repeated CT were significantly lower than those of early CT in poor-outcome patients. Streitberger et al[10] reported that the sensitivity to predict poor outcomes was higher in late CTs (>24 h after CA) compared with that in early CTs (<6 h after CA), as GWR decreased over time in severe HIBI survivors. In addition, under hypoxic conditions, the basal ganglia with high metabolic turnover are one of the first sites to be influenced. It seems that edema is much more severe in the basal ganglia area, particularly in the PU.[20] Similar to these findings, the present study suggested that the GWR-basal ganglia of both early and late CTs, and PU of late CT were significantly lower in the poor-outcome group, as well as a significant increase in the prognostic performance of GWR in the late period.
Cerebral edema is a marked feature of HIBI in CA survivors. At the cellular level, non-contrast CT fails to directly observe edema,[21] but it can effectively assess abnormal characteristics, including the formation of edema through pCSFV. As the cranium consists of rigid confines, cerebral edema progress can lead to a decrease in intracranial CSF and blood volume as a result of a compensatory mechanism.[22] The proportion of voxels with CSF-specific attenuation can be a useful tool to evaluate the influence of brain edema and the CSF-volume changes on neurological prognosis. You et al[9] reported similarity between pCSFV prognostic performances that were poor overall and those of GWR. The reason may be that cerebral edema appears to be more prominent 24 h after ROSC. The present study found that GWR and pCSFV decreased significantly over time in patients with poor outcomes, and pCSFV in late CT can be considered a prognostic approach for CA patients. A pCSFV <0.03 predicted poor neurological outcomes with a sensitivity of 41.5% and a specificity of 100%. It is worth mentioning that the brain shows age-related changes, including an overall reduction in brain volume and enlargement of the CSF space.[9] Uncritical application of pCSFV cut-off values from a relatively older population could lead to false pessimistic prognostication in young patients.
Observations of stroke patients demonstrate that water content in the brain increases slowly over hours following the onset of ischemia.[23] When CT was performed in the early period after CA, the prognostic value of CT parameters was low for poor outcome prediction. Furthermore, a previous study showed that the cut-off values differed over various time for poor outcome prediction.[6] Severe HIBI leads to diffuse cerebral edema and delayed neuronal death. A recent neuropathology study indicated a strong link between histopathologically severe HIBI after CA and lower GWR (<1.10).[24] Therefore, the present study described novel metrics to evaluate the trends in relevant CT parameters, i.e., grey-matter density ratio, GWR ratio, and pCSFV ratio. The GWR and pCSFV ratios were both helpful in predicting poor outcomes. In particular, a pCSFV ratio ≤0.98 corresponded to decreasing pCSFV over the allotted time in poor outcome patients, which showed good specificity and higher sensitivity. The ratio may provide internal local consistency.
Several limitations exist in the present study. Firstly, the single-center location and relatively small sample size may limit generalizability. Secondly, because patients showed poor CPC at hospital discharge that was the primary clinical endpoint, rare cases of good neurological recovery might not be included in the study population despite the presence of cerebral edema in the early period following CA. Thirdly, the brain CT results were known by treating physicians and may have affected clinical decision-making. This may lead to a self-fulfilling prophecy. However, in our hospital, a multimodal approach over a relatively long observation period (at least 7 d) was used for evaluating prognosis and making decisions about the withdrawal of life-sustaining treatment.
CONCLUSIONS
Brain CT performed >24 h after CA may be a good choice as a neuroimaging approach to evaluating prognosis. Comparison analysis of different CT time (performed within 24 h and 24 h to 7 d) can be used as another promising tool to predict neurological outcomes in comatose CA survivors. Dynamic assessment of changes in relevant CT parameters (GWR and pCSFV) yields an improved prognostic value to predict unfavorable outcomes in post-CA patients.
Funding: This study was supported by Ruiyi Special Fund for Emergency Medicine Research (R2019019); Postgraduate Research & Practice Innovation Program of Jiangsu Province (SJCX20_0481).
Ethical approval: The study protocol was approved by the Ethics Committee of the First Affiliated Hospital of Nanjing Medical University (No. 2018-SR-356).
Conflicts of interest: The authors have no conflicts of interest to declare.
Contributors: GNW proposed and designed the study. WC and XQX analyzed and interpreted the data. GNW and ZMZ wrote the primary draft of the manuscript. JSZ revised the manuscript. All authors read and approved the final version of the manuscript.
All the supplementary files in this paper are available at http://wjem.com.cn.
Reference
Effects of extracellular vesicles from mesenchymal stem cells on oxygen-glucose deprivation/reperfusion-induced neuronal injury
DOI:10.5847/wjem.j.1920-8642.2021.01.010 URL [Cited within: 1]
Heart disease and stroke statistics-2020update:a report from the American Heart Association
Left-sided vagus nerve stimulation improves cardiopulmonary resuscitation outcomes in rats as effectively as right-sided vagus nerve stimulation
DOI:10.5847/wjem.j.1920-8642.2021.04.010 URL [Cited within: 1]
Prognostication after cardiac arrest
DOI:10.1186/s13054-018-2060-7 URL [Cited within: 1]
Neuroimaging in cardiac arrest prognostication
DOI:10.1055/s-0036-1594253 URL [Cited within: 1]
Brain imaging in comatose survivors of cardiac arrest: Pathophysiological correlates and prognostic properties
DOI:S0300-9572(18)30889-X
PMID:30244045
[Cited within: 2]

Hypoxic-ischemic brain injury is the main cause of death and disability of comatose patients after cardiac arrest. Early and reliable prognostication is challenging. Common prognostic tools include clinical neurological examination and electrophysiological measures. Brain imaging is well established for diagnosis of focal cerebral ischemia but has so far not found worldwide application in this patient group.To review the value of Computed Tomography (CT), Magnetic Resonance Imaging (MRI), and Positron Emission Tomography (PET) for early prediction of neurological outcome of comatose survivors of cardiac arrest.A literature search was performed to identify publications on CT, MRI or PET in comatose patients after cardiac arrest.We included evidence from 51 articles, 21 on CT, 27 on MRI, 1 on CT and MRI, and 2 on PET imaging. Studies varied regarding timing of measurements, choice of determinants, and cut-off values predicting poor outcome. Most studies were small (n = 6-398) and retrospective (60%). In general, cytotoxic oedema, defined by a grey-white matter ratio <1.10, derived from CT, or MRI-diffusion weighted imaging <650 × 10 mm/s in >10% of the brain could differentiate between patients with favourable and unfavourable outcomes on a group level within 1-3 days after cardiac arrest. Advanced imaging techniques such as functional MRI or diffusion tensor imaging show promising results, but need further evaluation.CT derived grey-white matter ratio and MRI based measures of diffusivity and connectivity hold promise to improve outcome prediction after cardiac arrest. Prospective validation studies in a multivariable approach are needed to determine the additional value for the individual patient.Copyright © 2018 Elsevier B.V. All rights reserved.
Imaging for neuroprognostication after cardiac arrest: systematic review and meta-analysis
DOI:10.1007/s12028-019-00842-0 URL [Cited within: 1]
Neuroprognostication after adult cardiac arrest treated with targeted temperature management: task force for Belgian recommendations
DOI:10.1007/s13760-017-0755-1
PMID:28168412
[Cited within: 2]
The prognosis of patients who are admitted to the hospital after cardiac arrest often relies on neurological examination, which could be significantly influenced by the use of sedative drugs or the implementation of targeted temperature management. The need for early and accurate prognostication is crucial as up to 15-20% of patients could be considered as having a poor outcome and may undergo withdrawal of life-sustaining therapies while a complete neurological recovery is still possible. As current practice in Belgium is still based on a very early assessment of neurological function in these patients, the Belgian Society of Intensive Care Medicine created a multidisciplinary Task Force to provide an optimal approach for monitoring and refine prognosis of CA survivors. This Task Force underlined the importance to use a multimodal approach using several additional tools (e.g., electrophysiological tests, neuroimaging, biomarkers) and to refer cases with uncertain prognosis to specialized centers to better evaluate the extent of brain injury in these patients.
Usefulness of a quantitative analysis of the cerebrospinal fluid volume proportion in brain computed tomography for predicting neurological prognosis in cardiac arrest survivors who undergo target temperature management
DOI:10.1016/j.jcrc.2019.02.024 URL [Cited within: 4]
Timing of brain computed tomography and accuracy of outcome prediction after cardiac arrest
DOI:S0300-9572(19)30636-7
PMID:31585185
[Cited within: 2]
Gray-white-matter ratio (GWR) calculated from head CT is a radiologic index of tissue changes associated with hypoxic-ischemic encephalopathy after cardiac arrest (CA). Evidence from previous studies indicates high specificity for poor outcome prediction at GWR thresholds of 1.10-1.20. We aimed to determine the relationship between accuracy of neurologic prognostication by GWR and timing of CT.We included 195 patients admitted to the ICU following CA. GWR was calculated from CT radiologic densities in 16 regions of interest. Outcome was determined upon intensive care unit discharge using the cerebral performance category (CPC). Accuracy of outcome prediction of GWR was compared for 3 epochs (<6, 6-24, and >24 h after CA).125 (64%) patients had poor (CPC4-5) and 70 (36%) good outcome (CPC1-3). Irrespective of timing, specificity for poor outcome prediction was 100% at a GWR threshold of 1.10. Among 50 patients with both early and late CT, GWR decreased significantly over time (p = 0.002) in patients with poor outcome, sensitivity for poor outcome prediction was 12% (7-20%) with early CTs (<6 h) and 48% (38-58%) for late CTs (>24 h). Across all patients, sensitivity of early and late CT was 17% (9-28%) and 39% (28-51%), respectively.A GWR below 1.10 predicts poor outcome (CPC4-5) in patients after CA with high specificity irrespective of time of acquisition of CT. Because GWR decreases over time in patients with severe HIE, sensitivity for prediction of poor outcome is higher for late CTs (>24 h after CA) as compared to early CTs (<6 h after CA).Copyright © 2019 Elsevier B.V. All rights reserved.
Prognostic value of reduced discrimination and oedema on cerebral computed tomography in a daily clinical cohort of out-of-hospital cardiac arrest patients
DOI:10.1016/j.resuscitation.2015.03.023
PMID:25882783
[Cited within: 1]
Assessment of prognosis after out-of-hospital cardiac arrest (OHCA) is challenging. Cerebral computed tomography (cCT) scans are widely available, but the use in prognostication of comatose OHCA-patients is unclear. We evaluated the prognostic value of cCT in a clinical cohort of OHCA-patients.A total of 1120 consecutive OHCA-patients with cardiac aetiology and successful or on-going resuscitation at hospital arrival were included (2002-2011). Utstein-criteria for registration of pre-hospital data and review of patient-charts for post-resuscitation care including cCT results were used. The primary endpoint was 30-day mortality analysed by log-rank and multivariate Cox-regression analyses.A cCT scan was performed in 341(30%) of the clinical OHCA-cohort, and an early CT (<24h) was performed in 188 patients. The early CT was found 'normal' in 163(89%) and with reduced discrimination in 7(4%) of patients, which was independently associated with higher 30-day mortality compared with OHCA-patients with an early cCT (HR(adjusted) = 3.5 (95%CI: 1.0-11.5), p = 0.04). A late CT (≥ 24 h) was performed in 153 patients in a median of 3 days (IQR: 2-5) and was 'normal' in 89(60%), 'cerebral bleeding' in 4(3%), 'new cerebral infarction' in 10(7%), and 'reduced discrimination between white and grey matter and/or oedema' in 45(30%) patients. 'Reduced discrimination and/or oedema' by late cCT was independently associated with higher 30-day mortality compared to patients with a normal late CT (HR(adjusted) = 2.6 (95%CI: 1.4-4.8, p = 0.002).Our observations suggest that a cCT may be useful as part of the neurological prognostication in patients with OHCA. 'Reduced discrimination between white and grey matter and/or oedema' on cCT was independently associated with a poor prognosis.Copyright © 2015 Elsevier Ireland Ltd. All rights reserved.
Recommended guidelines for reviewing, reporting, and conducting research on post-resuscitation care: the Utstein style
PMID:16129543
[Cited within: 1]
The aim of this report is to establish recommendations for reviewing, reporting, and conducting research during the post-resuscitation period in hospital. It defines data that are needed for research and more specialised registries and therefore supplements the recently updated Utstein template for resuscitation registries. The updated Utstein template and the out-of-hospital "Chain of Survival" describe factors of importance for successful resuscitation up until return of spontaneous circulation (ROSC). Several factors in the in-hospital phase after ROSC are also likely to affect the ultimate outcome of the patient. Large differences in survival to hospital discharge for patients admitted alive are reported between hospitals. Therapeutic hypothermia has been demonstrated to improve the outcome, and other factors such as blood glucose, haemodynamics, ventilatory support, etc., might also influence the result. No generally accepted, scientifically based protocol exists for the post-resuscitation period in hospital, other than general brain-oriented intensive care. There is little published information on this in-hospital phase. This statement is the result of a scientific consensus development process started as a symposium by a task force at the Utstein Abbey, Norway, in September 2003. Suggested data are defined as core and supplementary and include the following categories: pre-arrest co-morbidity and functional status, cause of death, patients' quality of life, in-hospital system factors, investigations and treatment, and physiological data at various time points during the first three days after admission. It is hoped that the publication of these recommendations will encourage research into the in-hospital post-resuscitation phase, which we propose should be included in the chain-of-survival as a fifth ring. Following these recommendations should enable better understanding of the impact of different in-hospital treatment strategies on outcome.
The prognostic value of gray-white matter ratio on brain computed tomography in adult comatose cardiac arrest survivors
DOI:10.1016/j.jcma.2018.03.003 URL [Cited within: 1]
Automated quantification of cerebral edema following hemispheric infarction: application of a machine-learning algorithm to evaluate CSF shifts on serial head CTs
DOI:10.1016/j.nicl.2016.09.018 URL [Cited within: 1]
Reliability of the Cerebral Performance Category to classify neurological status among survivors of ventricular fibrillation arrest: a cohort study
DOI:10.1186/1757-7241-19-38 URL [Cited within: 1]
Prognostication in comatose survivors of cardiac arrest: an advisory statement from the European Resuscitation Council and the European Society of Intensive Care Medicine
PMID:25438253
[Cited within: 1]
To review and update the evidence on predictors of poor outcome (death, persistent vegetative state or severe neurological disability) in adult comatose survivors of cardiac arrest, either treated or not treated with controlled temperature, to identify knowledge gaps and to suggest a reliable prognostication strategy.GRADE-based systematic review followed by expert consensus achieved using Web-based Delphi methodology, conference calls and face-to-face meetings. Predictors based on clinical examination, electrophysiology, biomarkers and imaging were included.Evidence from a total of 73 studies was reviewed. The quality of evidence was low or very low for almost all studies. In patients who are comatose with absent or extensor motor response at ≥72 h from arrest, either treated or not treated with controlled temperature, bilateral absence of either pupillary and corneal reflexes or N20 wave of short-latency somatosensory evoked potentials were identified as the most robust predictors. Early status myoclonus, elevated values of neuron specific enolase at 48 72 h from arrest, unreactive malignant EEG patterns after rewarming, and presence of diffuse signs of postanoxic injury on either computed tomography or magnetic resonance imaging were identified as useful but less robust predictors. Prolonged observation and repeated assessments should be considered when results of initial assessment are inconclusive. Although no specific combination of predictors is sufficiently supported by available evidence, a multimodal prognostication approach is recommended in all patients.
Part 8: post-cardiac arrest care: 2015 American Heart Association guidelines update for cardiopulmonary resuscitation and emergency cardiovascular care
Grey-white matter ratio measured using early unenhanced brain computed tomography shows no correlation with neurological outcomes in patients undergoing targeted temperature management after cardiac arrest
DOI:10.1016/j.resuscitation.2019.03.039 URL [Cited within: 2]
Head computed tomography for prognostication of poor outcome in comatose patients after cardiac arrest and targeted temperature management
DOI:S0300-9572(17)30270-8
PMID:28687281
[Cited within: 1]
A multimodal approach to prognostication of outcome after cardiac arrest (CA) is recommended. Evidence for combinations of methods is low. In this post-hoc analysis we described findings on head computed tomography (CT) after CA. We also examined whether generalised oedema on CT alone or together with the biomarker Neuron-specific enolase (NSE) could predict poor outcome.Patients participating in the Target Temperature Management after out-of-hospital-cardiac-arrest-trial underwent CT based on clinical indications. Findings were divided into pre-specified categories according to local radiologists descriptions. Generalised oedema alone and in combination with peak NSE at either 48h or 72h was correlated with poor outcome at 6 months follow-up using the Cerebral Performance Category (CPC 3-5).356/939 (37.9%) of patients underwent head CT. Initial CT≤24h after CA was normal in 174/218 (79.8%), whilst generalised oedema was diagnosed in 21/218 (9.6%). Between days 1-7, generalised oedema was seen in 65/143 (45.5%), acute/subacute infarction in 27/143 (18.9%) and bleeding in 9/143 (6.3%). Overall, generalised oedema predicted poor outcome with 33.6% sensitivity (95%CI:28.1-39.5) and 98.4% specificity (95%CI:94.3-99.6), whilst peak NSE demonstrated sensitivities of 61.5-64.8% and specificity 95.7% (95%CI:89.5-98.4). The combination of peak NSE>38ng/l and generalised oedema on CT predicted poor outcome with 46.0% sensitivity (95%CI:36.5-55.8) with no false positives. NSE was significantly higher in patients with generalised oedema.In this study, generalised oedema was more common >24h≤7d after CA. The combination of CT and NSE improved sensitivity and specificity compared to CT alone, with no false positives in this limited population.Copyright © 2017 Elsevier B.V. All rights reserved.
Regional differences in susceptibility to hypoxic-ischemic injury in the preterm brain: exploring the spectrum from white matter loss to selective grey matter injury in a rat model
Specific changes in human brain following reperfusion after cardiac arrest
PMID:8091457
[Cited within: 1]
Very few reports are available on serial changes in human brain after cardiac arrest. The primary objective of this study is to investigate sequential neuroradiological changes in patients remaining in a persistent vegetative state following resuscitation after cardiac arrest.We repeatedly studied eight vegetative patients resuscitated from unexpected out-of-hospital cardiac arrest using computed tomographic (CT) scanning and high-field magnetic resonance (MR) imaging at 1.5 T.In seven of the eight patients, CT scans obtained between days 2 and 6 features symmetrical low-density lesions in the bilateral caudate, lenticular, and/or thalamic nuclei. These ischemic lesions were persistently of low density on serial CT scans. In these seven patients, MR images demonstrated what were thought to be hemoglobin degradation products derived from minor hemorrhages localized in the bilateral basal ganglia, thalami, and/or substantia nigra. Diffuse brain edema in the acute stage and diffuse brain atrophy in the chronic stage were consistent neuroradiological findings. No abnormal enhanced lesions were demonstrated by CT scans.The most characteristic findings on high-field MR images were symmetrical lesions in the bilateral basal ganglia, thalami, and/or substantia nigra with specific changes suggestive of minor hemorrhages that were not evident on CT scans. We speculate that these minor hemorrhages result from diapedesis of red blood cells in these regions during the reperfusion period through the endothelium disrupted by ischemia-reperfusion insult.
Cerebral edema after cardiopulmonary resuscitation: a therapeutic target following cardiac arrest
DOI:10.1007/s12028-017-0474-8
PMID:29080068
[Cited within: 1]
We sought to review the role that cerebral edema plays in neurologic outcome following cardiac arrest, to understand whether cerebral edema might be an appropriate therapeutic target for neuroprotection in patients who survive cardiopulmonary resuscitation. Articles indexed in PubMed and written in English. Following cardiac arrest, cerebral edema is a cardinal feature of brain injury and is a powerful prognosticator of neurologic outcome. Like other conditions characterized by cerebral ischemia/reperfusion, neuroprotection after cardiac arrest has proven to be difficult to achieve. Neuroprotection after cardiac arrest generally has focused on protecting neurons, not the microvascular endothelium or blood-brain barrier. Limited preclinical data suggest that strategies to reduce cerebral edema may improve neurologic outcome. Ongoing research will be necessary to determine whether targeting cerebral edema will improve patient outcomes after cardiac arrest.
Computed tomography-based quantification of lesion water uptake identifies patients within 4.5 hours of stroke onset: a multicenter observational study
DOI:10.1002/ana.24818
PMID:28001316
[Cited within: 1]
Many patients with stroke cannot receive intravenous thrombolysis because the time of symptom onset is unknown. We tested whether computed tomography (CT)-based quantification of water uptake in the ischemic tissue can identify patients with stroke onset within 4.5 hours, the time window of thrombolysis.Perfusion CT was used to identify ischemic brain tissue, and its density was measured in native CT and related to the density of the corresponding area of the contralateral hemisphere to quantify lesion water uptake. The optimal cutoff value of water uptake distinguishing stroke onset within and beyond 4.5 hours was calculated in patients with proximal middle cerebral artery occlusion (derivation cohort) with known time of symptom onset. The so-derived cutoff value was validated in a prospective cohort from other stroke centers.Of 178 patients of the derivation cohort, 147 (82.6%) had CT within 4.5 hours. Percentage water uptake was significantly lower in patients with stroke onset within compared to beyond 4.5 hours. The area under the receiver operating characteristic curve for distinguishing these patient groups according to percentage water uptake was 0.999 (95% confidence interval = 0.996-1.000, p < 0.001) with an optimal cutoff value of 11.5%. Applying this cutoff to the validation cohort of 240 patients, sensitivity was 98.6%, specificity 90.5%, positive predictive value 99.1%, and negative predictive value 86.4%.Quantification of brain water uptake identifies stroke patients with symptom onset within 4.5 hours with high accuracy and may guide the decision to use thrombolysis in patients with unknown time of stroke onset. Ann Neurol 2016;80:924-934.© 2016 American Neurological Association.
Hypoxic-ischemic encephalopathy evaluated by brain autopsy and neuroprognostication after cardiac arrest
DOI:10.1001/jamaneurol.2020.2340 URL [Cited within: 1]
