


INTRODUCTION
Acute kidney injury (AKI) is a syndrome characterized by a rapid (hours to days) deterioration of kidney function.[1,2]The incidence of AKI among critically ill patients and ST-segment elevation myocardial infarction (STEMI) patients is approximately 34% and 10%, respectively.[3] AKI is an independent risk factor for the prognosis of critical illness and causes high mortality of 62%.[4]Meanwhile, an epidemiological study in China indicated that approximately 1.4-2.9 million AKI patients were annually admitted; out of these patients, 28.5% were admitted to ICUs, and about 11.8% required renal replacement therapy.[5] Despite being expensive, continuous renal replacement therapy (CRRT) is currently the most prevalent renal replacement therapy used in the ICU.[6] A survey conducted in Jiangsu Province revealed that the average medical cost of CRRT for one AKI patient was 19,525 yuan.[7] The cost of AKI treatment poses a significant burden to society and families. Thus, it is important to balance the treatment efficacy and its cost.
In the current clinical practice, CRRT filters are regularly replaced based on the manufacturer's instructions. Meanwhile, an unscheduled replacement can happen for various reasons, such as instances of filter clotting and catheter malfunction.[8] Several studies indicate that the delivered dose of CRRT gradually decreases as the permeability of the filter membrane decreases with the extension of treatment time.[9⇓-11] Nonetheless, whether filter replacement based on schedule affects patient outcomes remains to be further investigated. Besides, it is essential to identify appropriate indicators for filter replacement.
Therefore, in this single-centered, randomized, and crossover trial, we analyzed dynamic changes of serum levels of solutes and relevant indicators of the two most common CRRT modalities, i.e., continuous veno-venous hemofiltration (CVVH) and continuous veno-venous hemodiafiltration (CVVHDF), in order to identify an optimal indicator for changing the filter of CRRT thus improving treatment efficiency.
METHODS
Baseline characteristics
AKI patients requiring CRRT treatment in an ICU in the Second Affiliated Hospital of Soochow University between July 2017 and December 2018 were recruited.
Inclusion criteria included: (1) nonsurgical patients, age ≥18 years old; (2) AKI diagnosed based on the KDIGO clinical practice guidelines for acute kidney injury, 2012;[12] (3) AKI patients with indicators that initiated CRRT, i.e., (a) stage 2 of AKI (supplementary Tables 1 and 2); (b) AKI patients combined with acute hypervolemic heart failure, acute pulmonary edema, hemodynamic instability due to septic shock,[13] severe acid-base and electrolyte disorders, multiple organ dysfunction that necessitated CRRT.
Exclusion criteria included: (1) patients with chronic renal failure or end-stage renal disease receiving maintenance dialysis; (2) the required treatment parameters could not be used because of the disease condition; (3) during the treatment process, the treatment mode and parameters needed to be changed according to the disease condition; (4) during the treatment process, the patient condition significantly changed, hence unsuitable to continue in the clinical trial; (5) the crossover remained unfinished because of the withdrawal or death.
Study design
Using a crossover design,[14] the recruited AKI patients were randomly divided into groups A and B using random numbers and envelope methods. Patients in the group A firstly received CVVH followed by CVVHDF. Conversely, patients in group B firstly received CVVHDF followed by CVVH. Since CRRT treatment did not have an apparent carry-over effect, non-treatment time for 30-40 minutes was required to switch from CVVH to CVVHDF and vice versa, which could be a sufficient wash-out period of the previous treatment.[15]
CRRT parameters
Femoral vein catheterization was performed in all patients. The prescribed dose of both CVVH and CVVHDF was 35 mL/(kg∙h) (post-dilution). The rate of dialysate flow and replacement fluid flow of CVVHDF was 1:1. The filter and circuit were pre-washed using 3 L normal saline with 37,500 U heparin sodium, maintained at 3-5 U/(kg∙h) in the process of CRRT. The activated partial thromboplastin time (APTT) of the filtered blood was maintained at 1.5-2.0 times of normal level by adjusting the dose of heparin. Filter replacement indicators were: transmembrane pressure (PTM) increase (≥300 mmHg [1 mmHg=0.133 kPa]), and pre-filter pressure (PPRE) increase (≥300 mmHg), filter and circuit use time reaching the specified length (≥60 h).
Observational indices
Observational indices included: (1) clinical characteristics: Acute Physiology and Chronic Health Evaluation II (APACHE II) score, Sequential Organ Failure Assessment (SOFA) score, serum level of urea nitrogen, creatinine, β2-microglobulin, and cystatin C before treatment; (2) solute removal efficiency: delivered dose (specific serum solute delivered clearance calculated using it's measured blood and effluent concentration), serum solute concentration, PPRE and PTM at different time points; (3) patient outcomes: duration of mechanical ventilation, length of ICU stay, renal function recovery rate, and the in-hospital mortality rate.
Sample collection and analysis
Blood samples were collected every 12 h after CRRT treatment initiation (the first sample was delayed 30 min to avoid pre-wash fluid contamination). PPRE and PTM at the time of collecting blood samples were recorded. Urea nitrogen, creatinine, β2-microglobulin, and cystatin C in blood and effluent samples were detected for calculating the delivered doses. The detailed equipment and materials were listed in the supplementary Table 3.
(1) Prescribed dose (KP, mL/[kg∙h])
(2) Delivered dose (KD, mL/[kg∙h])
The above formula was used for the calculation of the delivered dose of urea nitrogen. Solutes with other molecular weights were similarly calculated. In this formula, QD was the dialysate flow rate (mL/h), QUF was the ultrafiltration rate (mL/h), W was the body weight of the patient (kg), QR was the replacement liquid flow rate (mL/h), QNET was the net ultrafiltration rate (mL/h), UNF was the urea nitrogen level in the ultrafiltration, UNB was the urea nitrogen level in the blood (mmol/L), and QEFF was the effluent flow rate (mL/h).
Statistical analysis
The SPSS 23.0 software was used for statistical analyses. Enumeration data were expressed as number (%) and compared using the χ2 test. Fisher's exact test was performed in the condition where total frequency <40 or the frequency <1. Normally distributed measurement data were expressed as mean±standard deviation and compared using the single factor t-test; otherwise, they were expressed as median (interquartile range), and independent and paired samples were compared using Mann-Whitney U-test and Wilcoxon signed-rank test, respectively. Partial correlation analysis was performed to identify a correlation between delivered dose and PPRE and PTM. Receiver operating characteristic (ROC) curves were generated to assess the sensitivity and specificity of PTM in predicting the time to change the filter. A P-value <0.05 was considered statistically significant.
RESULTS
Baseline characteristics of recruited AKI patients
A total of 90 critically ill patients were recruited, whereas 26 were excluded. In total, 64 cases were randomly divided into groups A and B. During the treatment, 12 cases gave up the treatment, and 2 cases altered treatment parameters. Consequently, clinical data of 14 cases were not analyzed. Eventually, 50 eligible cases were analyzed, 27 cases in the group A and 23 in the group B. Flow chart showing the recruitment and research method is illustrated in the supplementary Figure 1. No significant differences were noted in sex, age, APACHE II score, SOFA score, serum urea nitrogen, creatinine, β2-microglobulin, and cystatin C between groups (all P>0.05). There were also no significant differences in patients' duration of mechanical ventilation, length of ICU stay, renal function recovery rate, and in-hospital mortality rate between groups (all P>0.05) (Table 1).
Figure 1.
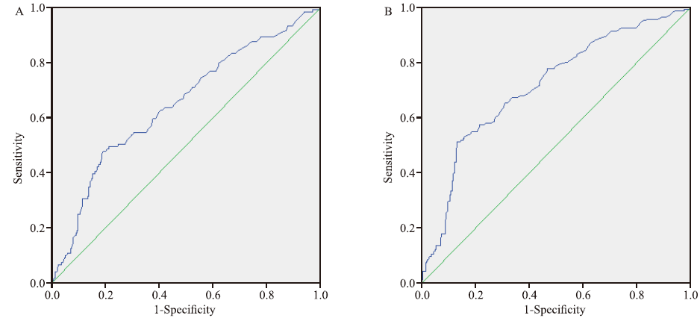
Figure 1.
ROC curves depicted for PTM. A: predicting the rebound of serum level of β2-microglobulin; B: predicting the rebound of serum level of cystatin C. ROC: receiver operating characteristic; PTM: transmembrane pressure.
Table 1. Clinical data of AKI patients before treatment
| Parameters | Group A (n=27) | Group B (n=23) | χ2/Z/t | P |
|---|---|---|---|---|
| Gender | ||||
| Male | 18 (66.7) | 16 (69.6) | χ2=0.118 | 0.732 |
| Female | 9 (33.3) | 7 (30.4) | χ2=0.250 | 0.617 |
| Age, years | 62 (38-79) | 61 (44-66) | Z= -0.681 | 0.496 |
| Height, cm | 167±8 | 169±9 | t= -0.870 | 0.388 |
| Body weight, kg | 70 (60-75) | 70 (57-75) | Z= -0.283 | 0.777 |
| APACHE II score | 19 (13-23) | 17 (13-20) | Z= -0.946 | 0.344 |
| SOFA score | 13 (9-16) | 11 (8-17) | Z= -0.078 | 0.938 |
| Primary diagnosis | ||||
| Septic shock | 17 (63.0) | 9 (39.1) | χ2=2.462 | 0.117 |
| Organ failure | 1 (3.7) | 5 (21.7) | χ2=2.667 | 0.102 |
| Poisoning of drugs or toxins | 6 (22.2) | 2 (8.7) | χ2=2.000 | 0.157 |
| Cardiac arrest | 2 (7.4) | 3 (13.0) | χ2=0.200 | 0.655 |
| AKI with unknown causes | 1 (3.7) | 4 (17.4) | χ2=1.800 | 0.180 |
| Urea nitrogen before treatment, mmol/L | 28.9±17.2 | 26.3±16.8 | t=0.553 | 0.583 |
| Creatinine before treatment, μmol/L | 615±650 | 437±223 | t=1.249 | 0.218 |
| β2-microglobulin before treatment, μg/L | 7,746.0±3,891.4 | 7,309.1±4,696.8 | t=0.360 | 0.721 |
| Cystatin C before treatment, mg/L | 1.77±0.72 | 1.86±0.73 | t= -0.414 | 0.681 |
| Duration of mechanical ventilation, h | 141±155 | 214±277 | t= -1.130 | 0.267 |
| ICU stay, h | 229±175 | 350±370 | t= -1.436 | 0.161 |
| Renal function recovery rate | 9 (33.3) | 10 (43.5) | χ2=0.053 | 0.819 |
| In-hospital mortality rate | 18 (66.7) | 13 (56.5) | χ2=0.806 | 0.369 |
Data were expressed as n (%), mean±standard deviation, and median (interquartile range). APACHE II: Acute Physiology and Chronic Health Evaluation II; SOFA: Sequential Organ Failure Assessment; AKI: acute kidney injury; ICU: intensive care units.
Dynamic changes of delivered doses
With the prolongation of CRRT, the delivered doses of small- and medium-molecular-weight solutes were decreased when treatment ceased (filter and circuit replacement), compared with delivered doses at the initiation of CRRT treatment, particularly those of medium-molecular-weight solutes (supplementary Figure 2).
In CVVH mode, delivered doses of urea nitrogen, creatinine, β2-microglobulin, and cystatin C decreased by 2.3% (0.4%-4.0%), 1.9% (0.2%-4.2%), 44.1% (15.8%-62.6%), and 45.5% (22.5%-70.3%), respectively (all P<0.05).
In CVVHDF mode, the delivered doses of urea nitrogen, creatinine, β2-microglobulin, and cystatin C decreased by 3.5% (0.5%-5.1%), 2.5% (0.5%-6.2%), 41.5% (16.9%-54.8%), and 45.1% (1.8%-68.4%), respectively (all P<0.05).
Dynamic changes of serum solute levels
Serum levels of small-molecular-weight solutes gradually decreased during the whole process of CRRT, whilst those of medium-molecular-weight solutes sharply decreased in the early stage of the treatment, then the magnitude of the decrease smoothly reduced in the middle and late stages. Moreover, the rebound of serum medium-molecular-weight solutes was observed in most patients in the late stage of CRRT treatment, which was more frequently observed with the prolongation of CRRT in both CVVH and CVVHDF mode. However, no significant difference between the two modalities was detected (P>0.05) (Table 2).
Table 2. Rebound ratio of serum solutes
| Time points | β2-microglobulin | χ2 | P | Cystatin C | χ2 | P | ||
|---|---|---|---|---|---|---|---|---|
| CVVH | CVVHDF | CVVH | CVVHDF | |||||
| 0.5 h | 1 (2.0) | 0 | - | 0.472 a | 1 (2.0) | 2 (3.5) | 0.000 | 1.000 b |
| 12 h | 11 (21.6) | 12 (21.1) | 0.004 | 0.948 | 12 (23.5) | 11 (19.3) | 0.288 | 0.592 |
| 24 h | 19 (43.2) | 16 (29.1) | 2.124 | 0.145 | 23 (52.5) | 29 (52.7) | 0.002 | 0.964 |
| 36 h | 11 (50.0) | 27 (57.4) | 0.336 | 0.562 | 14 (63.6) | 28 (59.6) | 0.104 | 0.747 |
| 48 h | 5 (45.5) | 19 (59.4) | 0.205 | 0.423 | 8 (72.7) | 24 (75.0) | 0.022 | 0.822 |
| 60 h | 3 (60.0) | 9 (52.9) | - | 1.000 a | 3 (60.0) | 10 (58.8) | - | 1.000 a |
Data were expressed as n (%). a: Fisher's exact test; b: correction of continuity. CVVH: continuous veno-venous hemofiltration; CVVHDF: continuous veno-venous hemodiafiltration.
Correlation analysis between delivered dose and PPRE and PTM
No significant correlation was noted between PPRE and delivered dose of either small-molecular-weight solutes or medium-molecular-weight solutes (both P>0.05). PTM was significantly correlated with the delivered dose of medium-molecular-weight solutes, rather than that of small-molecular-weight solutes (P<0.05). In CVVH mode, PTM was negatively correlated with the delivered dose of β2-microglobulin (r= -0.458, P<0.01) and cystatin C (r= -0.226, P<0.01). In CVVHDF mode, PTM was negatively correlated with the delivered dose of β2-microglobulin (r= -0.503, P<0.01) and cystatin C (r= -0.296, P<0.01) (supplementary Figure 3).
Potential of PTM in predicting the time to change the filter
The time point when a rebound of serum solutes occurred was considered the optimal time to change the filter of CRRT. As stated above, PTM was negatively correlated with delivered doses. To further investigate the predictive potential of PTM, ROC curves were generated to assess the sensitivity and specificity of PTM in predicting the rebound of β2-microglobulin and cystatin C.
The area under the curve (AUC) of PTM in predicting the rebound of β2-microglobulin was 0.651 (P<0.01), and the threshold of PTM was 146.5 mmHg (sensitivity=0.479, specificity=0.811) (Figure 1A).
The AUC of PTM in predicting the rebound of cystatin C was 0.717 (P<0.01), while the threshold of PTM was 146.5 mmHg (sensitivity=0.512, specificity=0.871) (Figure 1B).
DISCUSSION
In this study, we found that delivered doses of solutes with different molecular weight decreased in both modalities of CRRT when treatment ceased (filter and circuit replacement), compared with delivered doses at the initiation of CRRT treatment. Nonetheless, during all the CRRT courses, we did not detect a rebound of serum concentration of small-molecular-weight solutes. The delivered doses of medium-molecular-weight solutes decreased far more significantly than those of small-molecular-weight solutes; as a consequence, a rebound in their serum concentration was noted in most patients.
During CRRT treatment, clinicians and nurses often maximize the filter life span to minimize the treatment cost. Nevertheless, prolonged filter use causes membrane rupture, hence harming the patient. Thus, filters are often regularly replaced in the absence of clotting as per the experience or manufacturer's safe use time limits. A recent study reported that the use of citrate anticoagulation and non-convective modalities in reducing hemoconcentration prolonged the use of filters, thereby minimizing the treatment cost.[18] Nonetheless, our study and several others[9⇓-11] indicate that the delivered dose of CRRT gradually decreases as the filter membrane permeability decreases with the extension of treatment time. As such, the filter should be replaced before the delivered dose decreases. However, how often the filter should be replaced remains unresolved. Regarding the economics of treatment, a few studies minimized the cost of treatment by reducing the amount of replacement fluid[19] or using cheaper replacement fluid.[18] Here, we consider that instead of sacrificing the treatment dose of patients or even treatment safety to reduce costs, it is sustainably economical to flexibly use filters according to the treatment effect on patients. Thus, based on our findings, for patients requiring the removal of small-molecular-weight solutes, the filter should be used as long as possible within the manufacturer's safety limits. This lowers the treatment costs and increases treatment efficiency since the serum concentration of small-molecule-weight solutes continuously decreases during the treatment course. On the other hand, for patients requiring removal of medium-molecular-weight solutes, the filter should be replaced when the efficacy of the filter decreases to the point where it is unable to regulate the serum concentration of medium-molecular-weight solutes, and it's the point where patients' serum medium-molecular-weight solutes concentration rebounded. This occurs in the second half of the treatment; at this point, the treatment should ideally be stopped because the serum solute concentration of the patients cannot be effectively regulated due to filter function impairment.
Our study confirmed that PTM was significantly and negatively correlated with the delivered dose of medium-molecular-weight solutes in different treatment modalities; i.e., an increase in PTM indicated a decrease in the delivered dose. ROC curves demonstrated that PTM could precisely predict the rebound of serum level of cystatin C. Notably, the production rate of serum cystatin C is relatively constant, while that of β2-microglobulin is affected by multiple factors.[20] Thus, cystatin C is a promising indicator for serum levels of solutes. When PTM reaches 146.5 mmHg, the delivered dose of medium-molecular-weight solutes may be insufficient to regulate serum levels of solutes. Therefore, the time at which PTM reaches 146.5 mmHg may be the optimum time to change the filter among patients requiring the removal of medium-molecular-weight solutes.
Noteworthily, an important feature of ICU patients is their heterogeneity. For instance, the primary diseases were not identical. Besides, the treatment for their primary diseases was inconsistent or individualized even with the adoption of similar CRRT treatment parameters and modalities. In addition, pathophysiologic conditions including renal functional status are constantly changing in different patients, and the response to treatment varies in different stages of the disease. These potentially trigger variability in test results, specifically in small sample sizes.[21] A crossover experimental design was used to markedly eliminate the effect of differences in the underlying characteristics of different patients on the experimental results.[14]
This study has some limitations. First, it is a single-center study with a relatively small sample size (n=50). Although a crossover design was adopted, there was a possibility of errors due to the small sample size. In addition, numerous treatment and monitoring parameters of CRRT have been reported, and whether additional reliable indicators of filter replacement are available remains to be investigated.
CONCLUSIONS
In summary, the filter can be used during CRRT as long as possible within the manufacturer's safe use time limits to therapeutically remove small-molecular-weight solutes. Meanwhile, PTM of 146.5 mmHg may be an optimal indicator for changing the filter when removing medium-molecular-weight solutes during CRRT.
Funding: The study was supported by Kunshan Science and Technology Special Fund (Social Development Category, KS18040).
Ethical approval: This trial protocol was reviewed and approved by the ethics committee of the Second Affiliated Hospital of Soochow University.
Conflicts of interests: The authors declare that there is no conflict of interest.
Contributors: CH designed the research and wrote the paper. All authors contributed to the design and interpretation of the study and to further drafts.
All the supplementary files in this paper are available at http://wjem.com.cn.
Reference
Acute kidney injury 2016: diagnosis and diagnostic workup
DOI:10.1186/s13054-016-1478-z URL [Cited within: 1]
Early detection of acute kidney injury can further improve the prognosis of acute myocardial infarction
DOI:10.1016/j.jacasi.2021.08.005 URL [Cited within: 1]
A novel prediction model of acute kidney injury based on combined blood variables in STEMI
DOI:10.1016/j.jacasi.2021.07.013 URL [Cited within: 1]
Acute kidney injury enhances outcome prediction ability of sequential organ failure assessment score in critically ill patients
DOI:10.1371/journal.pone.0109649 URL [Cited within: 1]
Acute kidney injury in China: a cross-sectional survey
DOI:10.1016/S0140-6736(15)00344-X
PMID:26466051
[Cited within: 1]

Acute kidney injury (AKI) has become a worldwide public health problem, but little information is available about the disease burden in China. We aimed to evaluate the burden of AKI and assess the availability of diagnosis and treatment in China.We launched a nationwide, cross-sectional survey of adult patients who were admitted to hospital in 2013 in academic or local hospitals from 22 provinces in mainland China. Patients with suspected AKI were screened out on the basis of changes in serum creatinine by the Laboratory Information System, and we reviewed medical records for 2 months (January and July) to confirm diagnoses. We assessed rates of AKI according to two identification criteria: the 2012 Kidney Disease: Improving Global Outcomes (KDIGO) AKI definition and an increase or decrease in serum creatinine by 50% during hospital stay (expanded criteria). We estimated national rates with data from the 2013 report by the Chinese National Health and Family Planning Commission and National Bureau of Statistics.Of 2,223,230 patients admitted to the 44 hospitals screened in 2013, 154,950 (7·0%) were suspected of having AKI by electronic screening, of whom 26,086 patients (from 374,286 total admissions) were reviewed with medical records to confirm the diagnosis of AKI. The detection rate of AKI was 0·99% (3687 of 374,286) by KDIGO criteria and 2·03% (7604 of 374,286) by expanded criteria, from which we estimate that 1·4-2·9 million people with AKI were admitted to hospital in China in 2013. The non-recognition rate of AKI was 74·2% (5608 of 7555 with available data). Renal referral was done in 21·4% (1625 of 7604) of the AKI cases, and renal replacement therapy was done in 59·3% (531 of 896) of those who had the indications. Delayed AKI recognition was an independent risk factor for in-hospital mortality, and renal referral was an independent protective factor for AKI under-recognition and mortalityAKI has become a huge medical burden in China, with substantial underdiagnosis and undertreatment. Nephrologists should take the responsibility for leading the battle against AKI.National 985 Project of China, National Natural Science Foundation of China, Beijing Training Program for Talents, International Society of Nephrology Research Committee, and Bethune Fund Management Committee.Copyright © 2015 Elsevier Ltd. All rights reserved.
International survey on the management of acute kidney injury and continuous renal replacement therapies: year 2018
DOI:10.1159/000493724 URL [Cited within: 1]
Survey of continuous renal replacement therapy application status
Reasons for unscheduled filter replacement in continuous renal replacement therapy
A pulmonary source of infection in patients with sepsis-associated acute kidney injury leads to a worse outcome and poor recovery of kidney function
DOI:10.5847/wjem.j.1920-8642.2020.01.003 URL [Cited within: 2]
Actually delivered dose of continuous renal replacement therapy is underestimated in hemofiltration
DOI:10.1097/MAT.0000436713.34635.a8 URL [Cited within: 2]
Effluent volume in continuous renal replacement therapy overestimates the delivered dose of dialysis
DOI:10.2215/CJN.02500310 URL [Cited within: 3]
KDIGO clinical practice guidelines for acute kidney injury
Surviving Sepsis Campaign: International Guidelines for Management of Sepsis and Septic Shock: 2016
DOI:10.1007/s00134-017-4683-6 URL [Cited within: 1]
Design, analysis, and presentation of crossover trials
DOI:10.1186/1745-6215-10-27 URL [Cited within: 2]
A randomized, single-blind, crossover trial of recovery time in high-flux hemodialysis and hemodiafiltration
DOI:10.1053/j.ajkd.2016.10.025 URL [Cited within: 1]
Solute clearance in CRRT: prescribed dose versus actual delivered dose
DOI:10.1093/ndt/gfr480 URL [Cited within: 1]
Nomenclature for renal replacement therapy in acute kidney injury: basic principles
DOI:10.1186/s13054-016-1489-9 URL [Cited within: 1]
Cost analysis of two modalities of continuous renal replacement therapy
DOI:10.1111/hdi.12899 URL [Cited within: 2]
BEST Kidney Investigators. Cost of acute renal replacement therapy in the intensive care unit: results from The Beginning and Ending Supportive Therapy for the Kidney (BEST Kidney) study
DOI:10.1186/cc8933 URL [Cited within: 1]
Cystatin C in critically ill patients treated with continuous venovenous hemofiltration
Clinical research in critical care. Difficulties and perspectives
