


The incidence of in-hospital cardiac arrest (IHCA) has increased over the past decade, with more than half occurring in intensive care units (ICUs).[1] ICU cardiac arrest (ICU-CA) presents unique challenges, with worse outcomes than those in monitored wards, highlighting the need for early detection and intervention.[2] Up to 80% of patients exhibit signs of deterioration hours before IHCA.[3] Although early warning scores based on vital signs are useful, their effectiveness in ICUs is limited due to abnormal physiological parameters.[4] Laboratory markers, such as sodium, potassium, and lactate, are predictive of poor outcomes,[5] but static measurements may not capture the patient’s trajectory. Trends in laboratory indicators, such as variability and extremes, may offer better predictive value.[6] This study aimed to evaluate ICU-CA predictive factors, with a focus on vital signs and trends of laboratory indicators.
We conducted a retrospective matched case-control study from December 1st, 2016, to November 31st, 2019, in six ICUs of Qilu Hospital of Shandong University. Patients aged >14 years who experienced ICU-CA, defined as circulatory arrest receiving cardiopulmonary resuscitation (CPR), including chest compressions and/or cardiac defibrillation, were included. The exclusion criteria were do-not-attempt resuscitation orders, cardiac arrest (CA) before ICU admission, ICU stays <48 h, or intraoperative CA. Controls were patients without CA events during their ICU stays and were selected at a 1:2 ratio after being matched to CA cases by ICU, sex, admitting diagnosis, and admission date. All controls must have an ICU length of stay longer than the time to CA event of its corresponding case, allowing valid comparisons between these two groups within the time interval.
All clinical variables were collected retrospectively from the medical records. Vital signs (temperature, heart rate, respiratory rate, blood pressure, and oxygen saturation) and laboratory indicators (sodium, potassium, calcium, hemoglobin, lactate, and pH) were collected at 48, 36, 24, 12, and 8 h before ICU-CA or index time for controls. Missing data were filled using the last observation carried forward (LOCF) method.[7] Variability in laboratory indicators was assessed via mean, maximum, minimum, and range values.
Descriptive statistics are presented as median (interquartile range) or frequencies (%). Group comparisons were made via t-tests, Wilcoxon rank-sum tests, and χ² or Fisher’s exact tests. Univariable and multivariable logistic regression models were applied to assess predictors of ICU-CA, with odds ratios (ORs) and 95% confidence intervals (95% CIs), and the area under the receiver operating characteristic (AUROC) curve was used to indicate the predictive power of the laboratory indicator trends and variabilities for ICU-CA. P-values <0.05 were considered statistically significant. Analyses were conducted via IBM SPSS statistics 25.0. Detailed statistical methods are available in the supplementary material.
During the study period, 6,164 patients were treated in the six ICUs, with 1,042 identified as ICU-CA patients. After exclusions, 391 ICU-CA patients were included, and 782 patients were selected as controls (supplementary Figure 1). The baseline characteristics revealed a median age of 63 years, and the patients were predominantly male (70.9%), with frequent comorbidities such as hypertension, coronary artery disease (CAD), and diabetes mellitus (DM). Compared with the controls, the ICU-CA patients were slightly older and had higher rates of CAD (Table 1).
Figure 1.
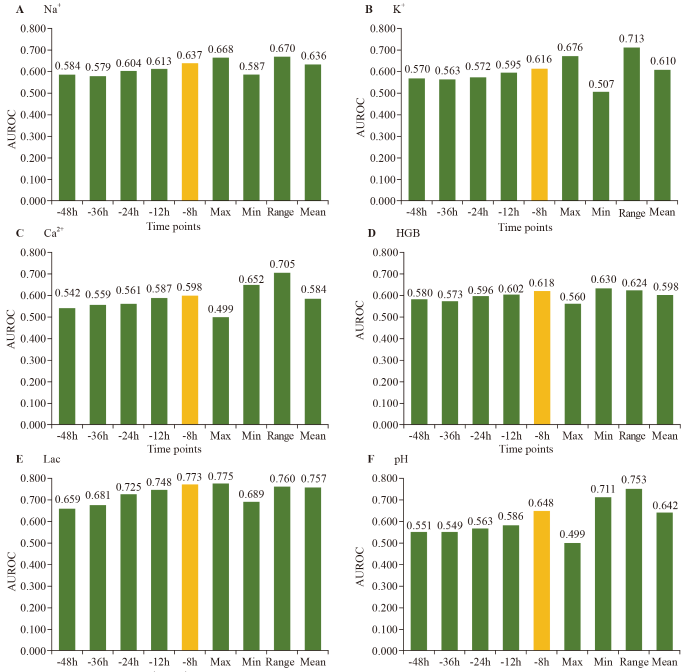
Figure 1.
AUROCs for the trend and variability of laboratory indicators. AUROC: area under the receiver operating characteristic curve; Na+: sodium; K+: potassium; Ca2+: calcium; HGB: hemoglobin; Lac: lactic acid; Max: maximum; Min: minimum.
Table 1. Baseline characteristics of the ICU-CA patients and controls
| Parameters | Overall (n=1,173) | ICU-CA patients (n=391) | Controls (n=782) | P-value |
|---|---|---|---|---|
| Age, years, median (IQR) | 63 (50, 73) | 64 (52, 74) | 62 (48, 73) | 0.023 |
| Sex (male), n (%) | 832 (70.9) | 277 (70.8) | 555 (71.0) | 0.964 |
| CAD, n (%) | 411 (35.0) | 155 (39.6) | 256 (32.7) | 0.019 |
| COPD, n (%) | 79 (6.7) | 29 (7.4) | 50 (6.4) | 0.510 |
| DM, n (%) | 265 (22.6) | 101 (25.8) | 164 (21.0) | 0.061 |
| Stroke, n (%) | 248 (21.1) | 78 (19.9) | 170 (21.7) | 0.479 |
| Malignancy, n (%) | 128 (10.9) | 48 (12.3) | 80 (10.2) | 0.289 |
| Hypertension, n (%) | 593 (50.6) | 186 (47.6) | 407 (52.0) | 0.148 |
| Hyperlipidemia, n (%) | 148 (12.6) | 51 (13.0) | 97 (12.4) | 0.756 |
| Current smoking, n (%) | 493 (42.0) | 168 (43.0) | 325 (41.6) | 0.645 |
| ICU, n (%) | 1.000 | |||
| General ICU | 648 (55.2) | 214 (54.7) | 434 (55.5) | |
| Emergency ICU | 53 (4.5) | 18 (4.6) | 35 (4.5) | |
| Cardiac ICU | 60 (5.1) | 20 (5.1) | 40 (5.1) | |
| Respiratory ICU | 89 (7.6) | 30 (7.7) | 59 (7.5) | |
| Neurosurgical ICU | 159 (1.3) | 5 (1.3) | 10 (1.3) | |
| Cardiac surgical ICU | 308 (26.3) | 104 (26.6) | 204 (26.1) |
IQR: interquartile range; ICU: intensive care unit; CA: cardiac arrest; CAD: coronary artery disease; COPD: chronic obstructive pulmonary disease; DM: diabetes mellitus.
Logistic regression identified several vital signs and laboratory markers significantly associated with ICU-CA. Heart rate (HR) and systolic blood pressure (SBP) at specific time points, as well as high sodium (Na+), potassium (K+), hemoglobin (HGB), lactate (Lac), and abnormal pH levels, were significant predictors of ICU-CA (supplementary Table 1). In the final model, Na+ >145 mmol/L, elevated K+, lower HGB, and elevated Lac were independently associated with ICU-CA (Table 2).
Table 2. Multivariable multilevel logistic regression analysis of the association of vital signs and laboratory indicators with ICU-CA
| Parameters | Coefficient | SE | OR (95% CI) | P-value |
|---|---|---|---|---|
| Intercept | -2.888 | 1.059 | 0.006 | |
| Na+, mmol/L | ||||
| <135 | -0.018 | 0.249 | 0.982 (0.602-1.601) | 0.941 |
| 135-145 | Ref | - | - | - |
| >145 | 0.740 | 0.231 | 2.095 (1.331-3.297) | 0.001 |
| K+ | 0.338 | 0.130 | 1.403 (1.087-1.810) | 0.009 |
| Ca2+ | -0.754 | 0.596 | 0.470 (0.146-1.513) | 0.206 |
| HGB, g/L | -0.009 | 0.004 | 0.991 (0.983-0.999) | 0.026 |
| Lac a, Log | 1.095 | 0.134 | 2.990 (2.298-3.891) | <0.001 |
| pH b | ||||
| <7.35 | 0.253 | 0.249 | 1.288 (0.790-2.099) | 0.310 |
| 7.35-7.45 | Ref | - | - | - |
| >7.45 | -0.043 | 0.192 | 0.958 (0.658-1.396) | 0.823 |
| Time c | -0.080 | 0.054 | 0.923 (0.831-1.026) | 0.137 |
| Age | 0.014 | 0.007 | 1.014 (0.999-1.029) | 0.070 |
| Sex, male | 0.024 | 0.254 | 1.024 (0.622-1.687) | 0.925 |
| CAD | 0.548 | 0.275 | 1.731 (1.008-2.970) | 0.047 |
| DM | 0.292 | 0.291 | 1.339 (0.757-2.368) | 0.316 |
| Malignancy | 0.266 | 0.369 | 1.304 (0.632-2.691) | 0.472 |
| Hypertension | -0.480 | 0.249 | 0.619 (0.380-1.010) | 0.055 |
| Stroke | -0.342 | 0.306 | 0.710 (0.390-1.295) | 0.264 |
a: the value of Lac was natural log-transformed; b: the value of pH was multiplied by 100; c: the time of collecting indicators. CA: cardiac arrest; SE: standard error; OR: odds ratio; CI: confidence interval; Na+: sodium; K+: potassium; Ca2+: calcium; HGB: hemoglobin; Lac: lactic acid; CAD: coronary artery disease; DM: diabetes mellitus.
Trends in laboratory markers, particularly Lac and pH, improved the predictive accuracy closer to the CA event, with Lac showing the highest predictive value at the -8 h time point (AUROC 0.773). The variability in markers including Na+, K+, HGB, Ca2+, pH, and Lac further enhanced the prediction, with the maximum value of Lac being the most accurate indicator (Figure 1). These findings suggest that both the trend and variability of laboratory indicators, especially Lac, offer valuable insights for the early prediction of ICU-CA, potentially improving clinical outcomes through timely interventions.
In this study, we identified laboratory indicators, including Na+, K+, HGB and Lac, as independent predictors of ICU-CA. Our analysis of trends and variability in these indicators revealed that their predictive accuracy improved closer to the event, with Lac showing the greatest improvement. Specifically, the minimum value of HGB, the range value of Na+, K+, Ca2+, pH, and the maximum value of Lac were the most accurate predictors. This highlights the importance of laboratory trends and variability in predicting ICU-CA, and this approach may offer a feasible method for the early detection of ICU-CA.
Previous studies[7,8] have explored the early prediction of IHCA, combining vital signs and laboratory findings. Recent advancements in the prediction of CA have led to a shift toward more efficient and precise methodologies, such as machine learning and artificial intelligence, which have become powerful tools and offer enhanced capabilities for predictive analytics of ICU-CA.[9⇓⇓-12] Ueno et al[13] proposed that a model that considers both vital signs and laboratory results outperforms a model that is based on vital signs alone in the prediction of IHCA in the ICU. In our study, vital signs, including HR and SBP, were associated with ICU-CA at certain time points, whereas laboratory values, such as Na+, K+, HGB and Lac, consistently predicted ICU-CA, suggesting that laboratory indicators might be more valuable in the ICU setting. Vital signs in ICUs are often normalized quickly through interventions, potentially masking underlying physiological disturbances, whereas laboratory tests provide a clearer picture of internal homeostasis. Furthermore, a study supports the use of variability in vital signs for IHCA prediction.[5] In our analysis, laboratory indicators, not vital signs, were more closely linked to ICU-CA, with trends and variability enhancing predictive accuracy. Since laboratory data are frequently available in ICUs, particularly through arterial blood gas analysis, this approach offers a feasible method for the early detection of ICU-CA.[14] Future models using interpretable machine learning algorithms for ICU-CA prediction could incorporate a broader range of vital signs and laboratory indicators, such as trends and variability, thereby allowing for more precise and patient-specific predictions.
This study has several limitations. First, this study was conducted in a single center, limiting the generalizability of the results. Second, the retrospective data may have had missing points. Although the LOCF method was used to handle missing data, some information bias remains. Third, despite the suitability of the study design, some factors may not have reached statistical significance because of the difference between the actual incidence of ICU-CA and the ratio observed in our study population.
In conclusion, laboratory indicators, including Na+, K+, HGB, and Lac, were independently associated with ICU-CA. The minimum HGB, range value of Na+, K+, Ca2+, pH, and maximum Lac were the most accurate predictors. Adding trends or variabilities of laboratory indicators may increase the accuracy of models designed to detect critical illness in the ICU in the future.
Funding: This study was supported by grants from the Key R&D Program of Shandong Province (2021ZLGX02); the National Science Foundation of China (81901934, 82325031); the National Key R&D Program of China (2020YFC1512700, 2020YFC1512705, 2020YFC1512703); and the Clinical Research Center of Shandong University (2020SDUCRCC025). The funding organizations had no involvement in any aspect of the study.
Ethical approval: The ethics approval of this study was approved by the Ethics Committee of Qilu Hospital of Shandong University (authorization number KYLL-202008-028). The waiver of informed consent was granted by the Ethics Committee of Qilu Hospital of Shandong University. All methods were performed in accordance with relevant guidelines and regulations. All experimental protocols were approved by Qilu Hospital of Shandong University. ClinicalTrials.gov Identifier: NCT04670458.
Conflicts of interest: All other authors declared no conflict of interest.
Contributors: WTS, JJM, and FX planned and established the project, including the procedures for data collection, drafted the manuscript and performed data analysis. SW performed detailed statistical analysis of the data. CP, JQZ, WZ, and QHY performed data collection and data analysis. JXM, XZ, and JZ performed data collection. JJM and FX reviewed critical revisions to the manuscript. All authors revised and approved the final manuscript
All the supplementary files in this paper are available at http://wjem.com.cn.
Reference
Improving mortality in pediatric out-of-hospital cardiac arrest events requires a multifactorial approach
DOI:10.1016/j.jacasi.2022.11.011 PMID:36873764 [Cited within: 1]
Unexpected cardiac arrests occurring inside the ICU: outcomes of a French prospective multicenter study
DOI:10.1007/s00134-020-05992-w
PMID:32152653
[Cited within: 1]

Cardiac arrest may occur unexpectedly in intensive care units (ICU). We hypothesize that certain patient characteristics and treatments are associated with survival and long-term functional outcome following in-ICU cardiac arrest.Over a 12-month period, cardiac arrests with resuscitation attempts were prospectively investigated in 45 French ICUs. Survivors were followed for 6 months.In total, 677 (2.16%) of 31,399 admitted patients had at least one in-ICU cardiac arrest with resuscitation attempt, 42% of which occurred on the day of admission. In 79% cases, one or more condition(s) likely to promote the occurrence of cardiac arrest was/were identified, including hypoxia (179 patients), metabolic disorders (122), hypovolemia (94), and adverse events linked to the life-sustaining devices in place (98). Return of spontaneous circulation was achieved in 478 patients, of whom 163 were discharged alive from ICU and 146 from hospital. Six-month survival with no or moderate functional sequel (118 of 125 patients alive) correlated with a number of organ failures ≤ 2 when cardiac arrest occurred (OR 4.17 [1.92-9.09]), resuscitation time ≤ 5 min (3.32 [2.01-5.47]), shockable rhythm cardiac arrests (2.13 [1.26-3.45]) or related to the life-sustaining devices in place (2.11 [1.22-3.65]), absence of preexisting disability (1.98 [1.09-3.60]) or disease deemed fatal within 5 years (1.70 [1.05-2.77]), and sedation (1.71 [1.06-2.75]).Only one in six patients with in-ICU cardiac arrest and resuscitation attempt was alive at 6 months with good functional status. Certain characteristics specific to cardiac arrests, resuscitation maneuvers, and the pathological context in which they happen may help clarify prognosis and inform relatives.
The prevalence and significance of abnormal vital signs prior to in-hospital cardiac arrest
DOI:10.1016/j.resuscitation.2015.08.016
PMID:26362486
[Cited within: 1]
Patients suffering in-hospital cardiac arrest often show signs of physiological deterioration before the event. The purpose of this study was to determine the prevalence of abnormal vital signs 1-4h before cardiac arrest, and to evaluate the association between these vital sign abnormalities and in-hospital mortality.We included adults from the Get With the Guidelines(®)- Resuscitation registry with an in-hospital cardiac arrest. We used two a priori definitions for vital signs: abnormal (heart rate (HR) ≤ 60 or ≥ 100 min(-1), respiratory rate (RR) ≤ 10 or >20 min(-1) and systolic blood pressure (SBP) ≤ 90 mm Hg) and severely abnormal (HR ≤ 50 or ≥ 130 min(-1), RR ≤ 8 or ≥ 30 min(-1) and SBP ≤ 80 mm Hg). We evaluated the association between the number of abnormal vital signs and in-hospital mortality using a multivariable logistic regression model.7851 patients were included. Individual vital signs were associated with in-hospital mortality. The majority of patients (59.4%) had at least one abnormal vital sign 1-4h before the arrest and 13.4% had at least one severely abnormal sign. We found a step-wise increase in mortality with increasing number of abnormal vital signs within the abnormal (odds ratio (OR) 1.53 (CI: 1.42-1.64) and severely abnormal groups (OR 1.62 (CI: 1.38-1.90)). This remained in multivariable analysis (abnormal: OR 1.38 (CI: 1.28-1.48), and severely abnormal: OR 1.40 (CI: 1.18-1.65)).Abnormal vital signs are prevalent 1-4h before in-hospital cardiac arrest on hospital wards. In-hospital mortality increases with increasing number of pre-arrest abnormal vital signs as well as increased severity of vital sign derangements.Copyright © 2015 Elsevier Ireland Ltd. All rights reserved.
The use of routine laboratory data to predict in-hospital death in medical admissions
The value of vital sign trends for detecting clinical deterioration on the wards
DOI:10.1016/j.resuscitation.2016.02.005
PMID:26898412
[Cited within: 2]
Early detection of clinical deterioration on the wards may improve outcomes, and most early warning scores only utilize a patient's current vital signs. The added value of vital sign trends over time is poorly characterized. We investigated whether adding trends improves accuracy and which methods are optimal for modelling trends.Patients admitted to five hospitals over a five-year period were included in this observational cohort study, with 60% of the data used for model derivation and 40% for validation. Vital signs were utilized to predict the combined outcome of cardiac arrest, intensive care unit transfer, and death. The accuracy of models utilizing both the current value and different trend methods were compared using the area under the receiver operating characteristic curve (AUC).A total of 269,999 patient admissions were included, which resulted in 16,452 outcomes. Overall, trends increased accuracy compared to a model containing only current vital signs (AUC 0.78 vs. 0.74; p<0.001). The methods that resulted in the greatest average increase in accuracy were the vital sign slope (AUC improvement 0.013) and minimum value (AUC improvement 0.012), while the change from the previous value resulted in an average worsening of the AUC (change in AUC -0.002). The AUC increased most for systolic blood pressure when trends were added (AUC improvement 0.05).Vital sign trends increased the accuracy of models designed to detect critical illness on the wards. Our findings have important implications for clinicians at the bedside and for the development of early warning scores.Copyright © 2016 Elsevier Ireland Ltd. All rights reserved.
Cardiac arrest in the intensive care unit: an assessment of preventability
DOI:S0300-9572(19)30607-0
PMID:31521775
[Cited within: 1]
Cardiac arrest in the intensive care unit (ICU-CA) is a common and highly morbid event. We investigated the preventability of ICU-CAs and identified targets for future intervention.This was a prospective, observational study of ICU-CAs at a tertiary care center in the United States. For each arrest, the clinical team was surveyed regarding arrest preventability. An expert, multi-disciplinary team of physicians and nurses also reviewed each arrest. Arrests were scored 0 (not at all preventable) to 5 (completely preventable). Arrests were considered 'unlikely but potentially preventable' or 'potentially preventable' if at least 50% of reviewers assigned a score of ≥1 or ≥3 respectively. Themes of preventability were assessed for each arrest.43 patients experienced an ICU-CA and were included. A total of 14 (32.6%) and 13 (30.2%) arrests were identified as unlikely but potentially preventable by the expert panel and survey respondents respectively, and an additional 11 (25.6%) and 10 (23.3%) arrests were identified as potentially preventable. Timing of response to clinical deterioration, missed/incorrect diagnosis, timing of acidemia correction, timing of escalation to a more senior clinician, and timing of intubation were the most commonly cited contributors to potential preventability. Additional themes identified included the administration of anxiolytics/narcotics for agitation later identified to be due to clinical deterioration and misalignment between team and patient/family perceptions of prognosis and goals-of-care.ICU-CAs may have preventable elements. Themes of preventability were identified and addressing these themes through data-driven quality improvement initiatives could potentially reduce CA incidence in critically-ill patients.Copyright © 2019. Published by Elsevier B.V.
Analysis of the proportional hazards model with sparse longitudinal covariates
PMID:26576066
[Cited within: 2]
Regression analysis of censored failure observations via the proportional hazards model permits time-varying covariates which are observed at death times. In practice, such longitudinal covariates are typically sparse and only measured at infrequent and irregularly spaced follow-up times. Full likelihood analyses of joint models for longitudinal and survival data impose stringent modelling assumptions which are difficult to verify in practice and which are complicated both inferentially and computationally. In this article, a simple kernel weighted score function is proposed with minimal assumptions. Two scenarios are considered: half kernel estimation in which observation ceases at the time of the event and full kernel estimation for data where observation may continue after the event, as with recurrent events data. It is established that these estimators are consistent and asymptotically normal. However, they converge at rates which are slower than the parametric rates which may be achieved with fully observed covariates, with the full kernel method achieving an optimal convergence rate which is superior to that of the half kernel method. Simulation results demonstrate that the large sample approximations are adequate for practical use and may yield improved performance relative to last value carried forward approach and joint modelling method. The analysis of the data from a cardiac arrest study demonstrates the utility of the proposed methods.
Multicenter development and validation of a risk stratification tool for ward patients
Prediction model of in-hospital mortality in intensive care unit patients with cardiac arrest: a retrospective analysis of MIMIC-IV database based on machine learning
BMC Anesthesiol.
Prediction of in-hospital cardiac arrest in the intensive care unit: machine learning-based multimodal approach
Early prediction of cardiac arrest in the intensive care unit using explainable machine learning: retrospective study
Dynamic individual vital sign trajectory early warning score (DyniEWS) versus snapshot national early warning score (NEWS) for predicting postoperative deterioration
DOI:10.1016/j.resuscitation.2020.10.037
PMID:33181231
[Cited within: 1]
International early warning scores (EWS) including the additive National Early Warning Score (NEWS) and logistic EWS currently utilise physiological snapshots to predict clinical deterioration. We hypothesised that a dynamic score including vital sign trajectory would improve discriminatory power.Multicentre retrospective analysis of electronic health record data from postoperative patients admitted to cardiac surgical wards in four UK hospitals. Least absolute shrinkage and selection operator-type regression (LASSO) was used to develop a dynamic model (DyniEWS) to predict a composite adverse event of cardiac arrest, unplanned intensive care re-admission or in-hospital death within 24 h.A total of 13,319 postoperative adult cardiac patients contributed 442,461 observations of which 4234 (0.96%) adverse events in 24 h were recorded. The new dynamic model (AUC = 0.80 [95% CI 0.78-0.83], AUPRC = 0.12 [0.10-0.14]) outperforms both an updated snapshot logistic model (AUC = 0.76 [0.73-0.79], AUPRC = 0.08 [0.60-0.10]) and the additive National Early Warning Score (AUC = 0.73 [0.70-0.76], AUPRC = 0.05 [0.02-0.08]). Controlling for the false alarm rates to be at current levels using NEWS cut-offs of 5 and 7, DyniEWS delivers a 7% improvement in balanced accuracy and increased sensitivities from 41% to 54% at NEWS 5 and 18% to -30% at NEWS 7.Using an advanced statistical approach, we created a model that can detect dynamic changes in risk of unplanned readmission to intensive care, cardiac arrest or in-hospital mortality and can be used in real time to risk-prioritise clinical workload.Copyright © 2020 The Authors. Published by Elsevier B.V. All rights reserved.
Value of laboratory results in addition to vital signs in a machine learning algorithm to predict in-hospital cardiac arrest: a single-center retrospective cohort study
An educational intervention optimizes the use of arterial blood gas determinations across ICUs from different specialties: a quality-improvement study
DOI:S0012-3692(16)62323-1
PMID:27818327
[Cited within: 1]
Overuse of arterial blood gas (ABG) determinations leads to increased costs, inefficient use of staff work hours, and patient discomfort and blood loss. We developed guidelines to optimize ABG use in the ICU.ABG use guidelines were implemented in all adult ICUs in our institution: three medical, two trauma-surgery, one cardiovascular, and one neurosurgical ICU. Although relying on pulse oximetry, we encouraged the use of ABG determination after an acute respiratory event or for a rational clinical concern and discouraged obtaining ABG measurements for routine surveillance, after planned changes of positive end-expiratory pressure or Fio on the mechanical ventilator, for spontaneous breathing trials, or when a disorder was not suspected. ABG measurements and global ICU metrics were collected before (year 2014) and after (year 2015) the intervention.We saw a reduction of 821.5 ± 257.4 ABG determinations per month (41.5%), or approximately one ABG determination per patient per mechanical ventilation (MV) day for each month (43.1%), after introducing the guidelines (P <.001). This represented 49 L of saved blood, a reduction of $39,432 in the costs of ICU care, and 1,643 staff work hours freed for other tasks. Appropriately indicated tests rose to 83.4% from a baseline 67.5% (P =.002). Less than 5% of inappropriately indicated ABG determinations changed patient management in the postintervention period. There were no significant differences in MV days, severity of illness, or ICU mortality between the two periods.The large scale implementation of guidelines for ABG use reduced the number of inappropriately ordered ABG determinations over seven different multidisciplinary ICUs, without negatively impacting patient care.Copyright © 2016. Published by Elsevier Inc.
