Development and validation of a predictive model for the assessment of potassium-lowering treatment among hyperkalemia patients
|
Development and validation of a predictive model for the assessment of potassium-lowering treatment among hyperkalemia patients |
| Cong-ying Song, Jian-yong Zhu, Wei Huang, Yuan-qiang Lu |
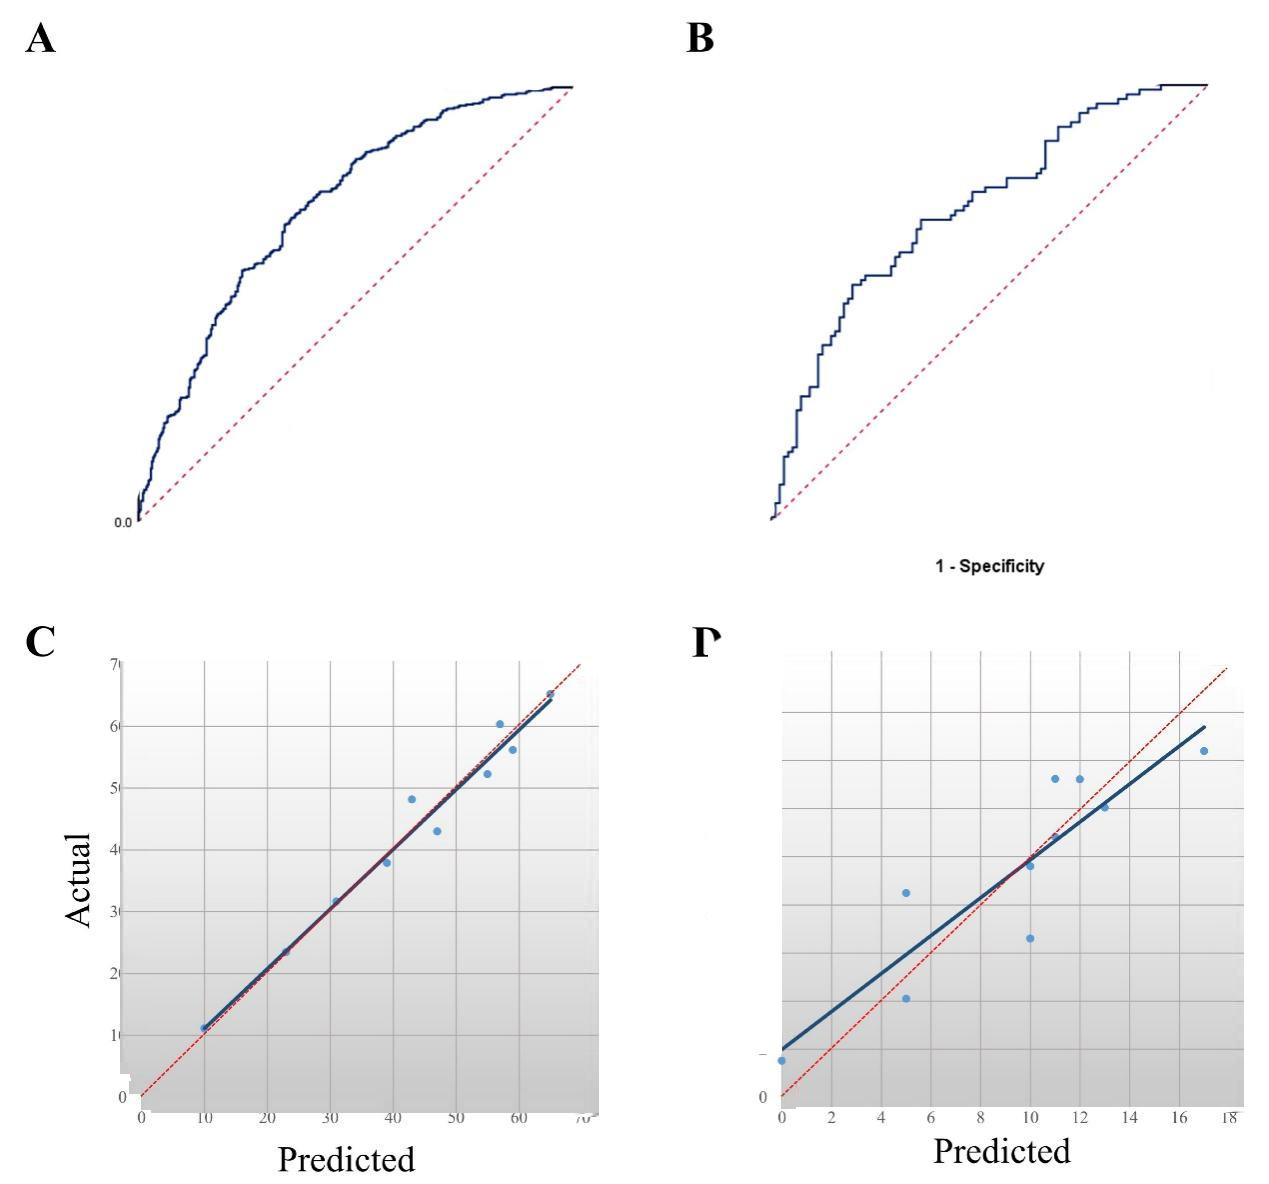
| Figure 2. Validation of the predictive model for assessing the effect of potassium-lowering treatment. A, B: ROC curve of the predictive model; the AUC showed that this predictive model had a quite good discriminative capacity; C, D: calibration curve of the predictive model. The Y-axis represents the actual number of patients with effective potassium-lowering treatment; the X-axis represents the predicted number of patients with effective potassium-lowering treatment. The orange line represents a perfect prediction by an ideal model. The blue line represents the performance of the novel model, of which a closer fit to the orange line represents a better prediction. ROC: receiver operating characteristic; AUC: area under the curve; 95% CI: 95% confidence interval. |
|
|